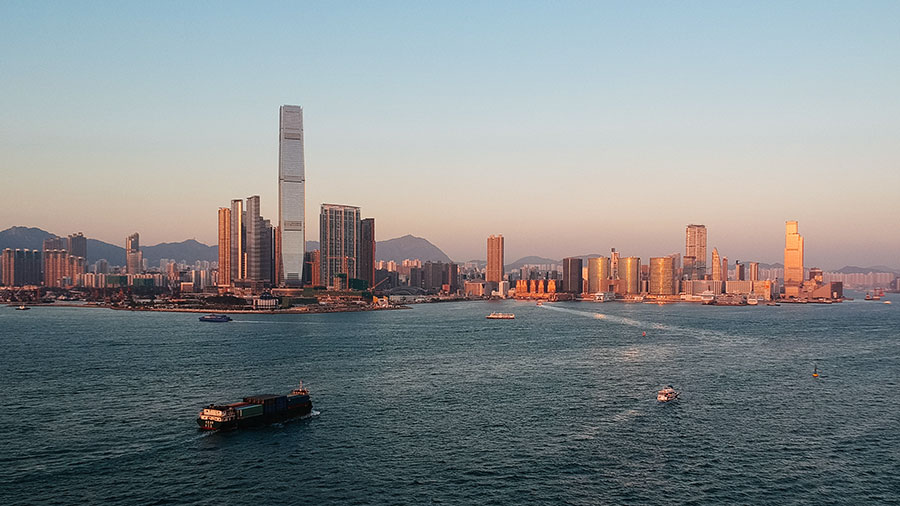
Economic Indicators and Hong Kong's GDP, FDI, and Trade Trends
Hong Kong Gross Domestic Product growth and 2024 forecast
According to the Hong Kong Half-Yearly Economic Report 2023, the economy saw a turnaround in the first quarter of 2023 after four consecutive quarters of decline.

Additionally, when adjusted for fluctuations, Hong Kong’s GDP increased 5.3 percent during the first quarter, showcasing the region's resilience in the face of recent challenges. These encouraging trends instilled optimism, with projections estimating growth between 4.0 percent and 5.0 percent for 2023.
The second quarter of 2023 witnessed Hong Kong’s revival progress, although slightly slower than the preceding quarter. Inbound tourism and increased private consumption were the factors contributing to this recovery. On a year-on-year basis, real GDP grew by 1.5 percent, reinforcing the durability of these sectors. However, there was a decline of 1.3 percent in real GDP quarterly when adjusted for variations, highlighting some ongoing challenges faced by the economy. Nonetheless, with relatively stable inflation, the government maintains its expectation that consumer prices will rise by around 2.0 percent in 2023.
The labor market has shown signs of improvement during the half of 2023, aligning with the economic recovery. From May to July 2023, the unemployment rate after adjustments declined to 2.8 percent compared to the rate of 2.9 percent recorded in the quarter. Additionally, there was a decrease in underemployment from 1.2 percent to 1.1 percent. These figures indicate an improvement in employment opportunities as the economy bounces back.
The export sector, however, had experienced declining rates of 9.1 percent in July 2023 and 14.6 percent for the first seven months year-on-year. Despite the decline, services exports, particularly the travel and transport sector, continue to grow significantly following Hong Kong’s dynamic economic landscape. Although overall investment expenditure declined slightly due to financial challenges, private consumption expenditure experienced notable growth in the second quarter.
According to forecasts, Hong Kong’s GDP Annual Growth Rate is expected to grow up to 3.3 percent by the end of 2023. Following an upward trajectory, the Hong Kong GDP Annual Growth Rate is projected to trend around 1.90 percent in 2024 and 2.10 percent in 2025
Foreign Direct Investment trends
Hong Kong showcased undeniable economic prowess, achieving impressive milestones in various financial sectors in 2022. It emerged as a key player in both the outflow and inflow of Foreign Direct Investment (FDI), ranking 7th globally for FDI outflows at a remarkable US$103.6 billion. Hong Kong solidified its position as the world's 5th largest FDI host, boasting an impressive FDI stock of US$2,09 billion. The city also secured the 5th spot for FDI investments with a total of US$ 2,05 billion. The UNCTAD World Investment Report 2023 acknowledged these exceptional figures, which recognized Hong Kong as a global magnet for FDI, placing it 4th worldwide with FDI inflows totaling US$ 117.7 billion in 2022.
Hong Kong's financial prowess extends beyond foreign direct investment (FDI) as it has established itself as a prominent economic hub in the Asia-Pacific region. According to a triennial survey by the Bank for International Settlements, Hong Kong emerged as Asia's second-largest foreign exchange market and the fourth-largest in 2022. Daily turnover of forex transactions witnessed a significant surge of 9.8 percent, with April 2022 recording transactions worth US$694.4 billion compared to US$632.1 billion in April 2019. Hong Kong's stock market retains its remarkable standing as the fourth-largest in Asia and seventh-largest worldwide, boasting an impressive total market capitalization of US$ 4.7 trillion as of March 2023. The city also showcases its fundraising capabilities by securing the fourth position worldwide in initial public offering (IPO) fundraising, raising a notable sum of US$12.7 billion through IPOs in 2021.
The Hang Seng Index (HSI) felt the pressure in the second quarter due to the Mainland economy's recovery momentum and expectations of higher rate hikes by the US Federal Reserve (Fed). The HSI concluded the quarter at 18,916, marking a 7.3 percent decrease from its end-March levels. In the real estate sector, the residential property market exhibited signs of consolidation after an initial rebound in the first quarter, as market sentiment turned cautious.
Forecasts indicate that Foreign Direct Investment in Hong Kong is set to reach HK$17 billion (US$2.1 billion) by the end of 2023, with further growth anticipated projecting an increase to HK$17.6 billion (US$2.3 billion) in 2024 and HK$18.4 billion (US$2.35 billion) in 2025. These projections highlight Hong Kong’s continued significance as a global financial and investment destination.
Hong Kong trade trends
Consumer prices increased by 1.8 percent in July 2023 compared to the same period the previous year, but lower than the 1.9 percent increase in June 2023. The government expects inflation to stay relatively constant, forecasting an underlying consumer price inflation rate of 2.0 percent for 2023. This projection indicates a degree of confidence in the nation's economic stability.
The retail sector grew rapidly, with nominal retail sales surging by 19.6 percent year-on-year in June 2023. These positive trends continued throughout the first half of 2023, with a provisional estimate indicating a year-on-year increase of 20.7 percent. This retail activity surge underscores consumer spending resilience, a crucial driver of economic development.
Between May and July 2023, the labor market continued to improve steadily. The unemployment rate dropped by 0.1 percentage points to 2.8 percent during this period, compared to the 2.9 percent recorded in April-June 2023. These trends collectively paint a picture of an economy on the path to stability and growth.
Merchandise exports fell 9.1 percent year-on-year in July 2023, with a drop of 14.6 percent year-on-year for the first seven months of the year. Total exports of goods also registered a significant dip, plummeting by 15.2 percent in real terms in the second quarter of 2023 compared to the same time a year earlier.
This decline continued the challenging environment, defined by slower external demand for goods, especially in major markets like the Mainland, the US, and the EU. Total goods exports slipped by 0.6 percent in the second quarter on a seasonally adjusted quarterly basis, following a modest 0.7 percent increase in the previous quarter.
Services exports increased by 22.9 percent year-on-year in the second quarter of 2023, following a 16.6 percent growth in the preceding quarter. The recovery of travel services, driven by a surge in visitor arrivals, primarily contributed to this remarkable performance, which experienced an eight-fold increase and recovered to 48 percent of pre-pandemic levels.
Transport services also followed this upward trajectory. Financial services exports faced headwinds as cross-border financial activities slowed in the face of tighter economic conditions. Service exports grew 5.4 percent in the second quarter, following a significant increase of 16.8 percent from the previous quarter. The diverse performance of goods and services highlights the complex dynamics at play in the global economy.
Hong Kong also plans to implement a new legal framework to facilitate company re-domiciliation, as revealed in a recent Hong Kong SAR Government consultation paper.
It would enable companies outside of Hong Kong to shift their incorporation focus to Hong Kong. This move aligns with Hong Kong’s efforts to become a hub for international companies, especially those focusing on Asia-Pacific. Hong Kong’s officials are still working on this plan's details, which will be developed in 2023-24. Additionally, Hong Kong has created the Hong Kong Investment Corporation Limited (HKIC) to boost its economy and attract more businesses and strategic investments.
According to forecasts, exports in Hong Kong are expected to be HK$359 billion (US$45.9 billion) by the end of this quarter. Hong Kong Exports are projected to trend around HK$41.7 billion (US$5.2 billion) in 2024 and HK$49.1 billion (US$6.2 billion) in 2025.
| Hong Kong Economic Profile (1990-2020) | ||||
| 1990 | 2000 | 2010 | 2020 | |
| World view | ||||
| Population, total (millions) | 5.7 | 6.67 | 7.02 | 7.48 |
| Population growth (annual %) | 0.3 | 0.9 | 0.7 | -0.3 |
| Surface area (sq. km) (thousands) | 1.1 | 1.1 | 1.1 | 1.1 |
| Population density (people per sq. km of land area) | 5,762.10 | 6,347.60 | 6,689.70 | 7,125.50 |
| Poverty headcount ratio at national poverty lines (% of population) | .. | .. | .. | .. |
| Poverty headcount ratio at $1.90 a day (2011 PPP) (% of population) | .. | .. | .. | .. |
| GNI, Atlas method (current US$) (billions) | 72.22 | 179.5 | 236.17 | 363.85 |
| GNI per capita, Atlas method (current US$) | 12,660 | 26,930 | 33,620 | 48,630 |
| GNI, PPP (current international $) (billions) | 101.32 | 189.82 | 352.8 | 494 |
| GNI per capita, PPP (current international $) | 17,760 | 28,480 | 50,230 | 65,800 |
| People | ||||
| Income share held by lowest 20% | .. | .. | .. | .. |
| Life expectancy at birth, total (years) | 77 | 81 | 83 | 85 |
| Fertility rate, total (births per woman) | 1.3 | 1 | 1.1 | 1.1 |
| Adolescent fertility rate (births per 1,000 women ages 15-19) | 7 | 4 | 3 | 3 |
| Contraceptive prevalence, any methods (% of women ages 15-49) | 86 | 86 | 75 | 67 |
| Births attended by skilled health staff (% of total) | .. | .. | .. | .. |
| Mortality rate, under-5 (per 1,000 live births) | .. | .. | .. | .. |
| Prevalence of underweight, weight for age (% of children under 5) | .. | .. | .. | .. |
| Immunization, measles (% of children ages 12-23 months) | .. | .. | .. | .. |
| Primary completion rate, total (% of relevant age group) | 104 | .. | 101 | 105 |
| School enrollment, primary (% gross) | 108.9 | 97.9 | 103.9 | 107.8 |
| School enrollment, secondary (% gross) | 75 | 80 | 88 | 108 |
| School enrollment, primary and secondary (gross), gender parity index (GPI) | 1 | .. | 1 | 1 |
| Prevalence of HIV, total (% of population ages 15-49) | .. | .. | .. | .. |
| Environment | ||||
| Forest area (sq. km) (thousands) | .. | .. | .. | .. |
| Terrestrial and marine protected areas (% of total territorial area) | .. | .. | .. | 48.9 |
| Annual freshwater withdrawals, total (% of internal resources) | .. | .. | .. | .. |
| Urban population growth (annual %) | 0.7 | 0.9 | 0.7 | -0.3 |
| Energy use (kg of oil equivalent per capita) | 1,511 | 2,039 | 1,947 | .. |
| CO2 emissions (metric tons per capita) | 5.34 | .. | .. | .. |
| Electric power consumption (kWh per capita) | 4,178 | 5,447 | 5,973 | .. |
| Economy | ||||
| GDP (current US$) (billions) | 76.93 | 171.67 | 228.64 | 346.59 |
| GDP growth (annual %) | 3.8 | 7.7 | 6.8 | -6.1 |
| Inflation, GDP deflator (annual %) | 7.6 | -3.4 | 0.3 | 0.6 |
| Agriculture, forestry, and fishing, value added (% of GDP) | .. | 0 | 0 | 0 |
| Industry (including construction), value added (% of GDP) | .. | 12 | 7 | 6 |
| Exports of goods and services (% of GDP) | 117 | 126 | 205 | 177 |
| Imports of goods and services (% of GDP) | 109 | 122 | 199 | 175 |
| Gross capital formation (% of GDP) | 27 | 28 | 24 | 19 |
| Revenue, excluding grants (% of GDP) | .. | .. | .. | .. |
| Net lending (+) / net borrowing (-) (% of GDP) | .. | .. | .. | .. |
| States and markets | ||||
| Time required to start a business (days) | .. | 11 | 6 | 2 |
| Domestic credit provided by financial sector (% of GDP) | .. | .. | .. | .. |
| Tax revenue (% of GDP) | .. | .. | .. | .. |
| Military expenditure (% of GDP) | .. | .. | .. | .. |
| Mobile cellular subscriptions (per 100 people) | 2.3 | 82.5 | 198 | 291.7 |
| Individuals using the Internet (% of population) | 0 | 27.8 | 72 | 92.4 |
| High-technology exports (% of manufactured exports) | .. | .. | 37 | 70 |
| Statistical Capacity Score (Overall Average) (scale 0 - 100) | .. | .. | .. | .. |
| Global links | ||||
| Merchandise trade (% of GDP) | 217 | 243 | 368 | 323 |
| Net barter terms of trade index (2000 = 100) | 100 | 100 | 97 | 97 |
| External debt stocks, total (DOD, current US$) (millions) | .. | .. | .. | .. |
| Total debt service (% of exports of goods, services and primary income) | .. | .. | .. | .. |
| Net migration (thousands) | 156 | 65 | 75 | 147 |
| Personal remittances, received (current US$) (millions) | .. | 136 | 340 | 458 |
| Foreign direct investment, net inflows (BoP, current US$) (millions) | 3,275 | 70,496 | 82,709 | 58,299 |
| Net official development assistance received (current US$) (millions) | 38.2 | .. | .. | .. |