
May 14 – UBS, a global financial services company, has recently published its exhaustive global summary of prices and earnings as part of a report released once every three years. Using their listed global benchmark of New York as a standard for comparison, we have extrapolated the data UBS produced on China and India regarding purchasing power and expenditure.
For the complete UBS report, please see here. For a comparison of wages in China and India, please see here.
Domestic purchasing power
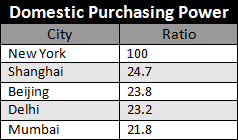
To calculate this figure, UBS compared price and wage level rankings by way of identifying a basket of goods and services and dividing the average annual salary into this figure. This allows for a comparison of the purchasing power of local wages, with the aim to identify how many goods a local worker can buy with their net wages. Consequently, cities with high tax rates scored poorly.
Setting New York as the standard with a weight of 100, we can see that Chinese and Indian consumers can attain a purchasing power of slightly less than a quarter of that of New Yorkers, and that purchasing power between Chinese and Indian consumers is quite even across major cities.
Food prices
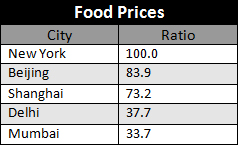
The global average cost of a basket of food according to UBS was US$424, comprising of 39 different food products weighted according to consumption (with staple foods being given a higher weighting).
New York priced out at US$552, while Beijing and Shanghai reached US$463 and US$404 respectively. This was, surprisingly, in spite of China ‘s massive agricultural production with far lower land and labor costs. India’s food prices landed at the opposite end of the scale, with the average basket for the same commodities costing just US$208 in Delhi and US$186 in Mumbai.
Clothing prices
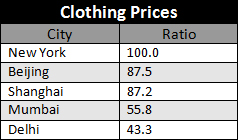
Prices for clothing were based on quality items from large department stores which were not classified as designer labels or fashion brands. Shopping for a complete man’s and lady’s outfit – jacket, trousers/skirt, shirt/blouse, underwear and shoes – in an off-the-rack, large department store costs an average of US$760 per outfit in New York, US$680 in Beijing, and US$680 in Shanghai. China is the world’s cheapest textile powerhouse, yet the markups on finished goods are somewhat high.
In India, the world’s second largest textile producer, consumers are able to purchase the same outfit for an average of US$430 and US$335 in Mumbai and Delhi respectively.
Home appliances and electronics
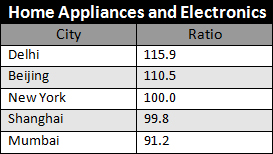
Across the globe the average price of electronics fluctuated from US$5,006 in Western Europe to over US$8,000 in Caracas. New York topped out at US$2,790, while China realized prices of US$4,370 in Beijing and US$3,950 in Shanghai – meaning the same goods cost more in Beijing and Shanghai than in New York, despite the likelihood that many of the products were manufactured in China.
Mumbai remains the lowest on the list at US$3,610 while Delhi was listed at US$4,590, an early sign that some electrical manufacturing is now relocating to India.
Working time required to buy a Big Mac
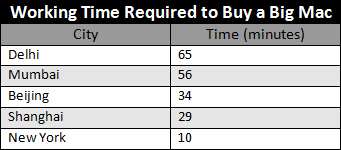
UBS’ Big Mac index seeks to determine how regional differences contribute to the price of a commodity that is essentially the same no matter where you purchase it, and includes salaries from 14 different types of professionals. The average worker in Mumbai needs to work for close to an hour to be able to afford a Big Mac, compared to just under 30 minutes in Shanghai.
Working time required to buy a 16 GB iPhone 4S
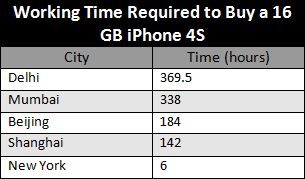
Similar to the Big Mac index, UBS calculated how long it took for workers in different cities worldwide to earn a 16GB iPhone 4S, one of the most sought-after Apple products. The results are astounding: a professional in Mumbai is required to work an eight hour day for 2 weeks to be able to purchase an iPhone 4S. Meanwhile, a professional in Shanghai has to work six days, while in New York a professional has to work for just 6 hours.
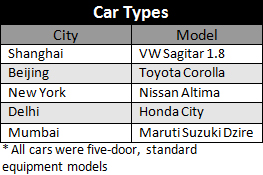
Car prices and running costs
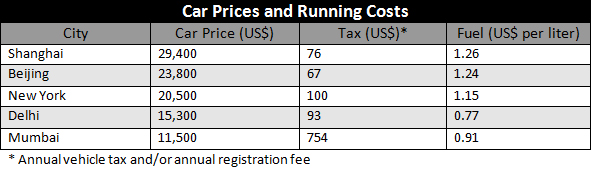
Due to different models being sold in different markets, the survey compared different yet similar models of vehicles. These were identified as:
The purchase price of new vehicles in China is significantly high, while also employing relatively high license taxes on new vehicles. This, however, may be due to governmental attempts to slow down auto sales in China through taxes. The cost of basic car models in China remain high, while costs in the United States have lowered as a whole.
Taxes are highest in Delhi due to the government restricting traffic in certain areas. Meanwhile, Mumbai purchase prices are the lowest, which is also due to polices that aim to remove old vehicles from the road in favor of new and environmentally friendly models.
Public transportation
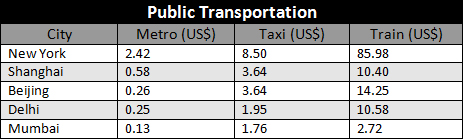
Journeys are defined as follows:
- Metro – journey of approximately 10 kilometers or at least 10 stops;
- Taxi – single journey within the city of 5 kilometers; and
- Train – single ticket, second class, journey of 200 kilometers.
The difference in price between China and India is not so significant. Public transportation throughout China and India remains of exceptional value due to infrastructure and travel costs being generally subsidized by the government.
