Top reasons to invest in India
India’s economy is on track to reach 6.5 percent growth in the fiscal year 2024-25 and will hit 7 percent in 2026, according to latest estimates from S&P Global. Data from the quarter ending September showed the Indian economy expanded 7.6 percent year-on-year.

This positions the country as a compelling foreign investment hub, which is also set to overtake China’s growth forecast of less than 5 percent in 2024. Even by the IMF’s conservative estimates, India will emerge as the world’s third-largest economy by 2027, surpassing Japan and Germany, with GDP exceeding US$5 trillion.
The country’s robust economic trajectory is underpinned by resilient growth and favorable demographics. After all, India is the most populous country in the world, with a median age of 28.2 years. After a prolonged pandemic, recovery in domestic demand, particularly in private consumption and household spending, should facilitate business expansion plans. India’s large consumer base, rising urban incomes, and the aspirations of the world’s largest young population are feeding into this. A recent World Bank report titled “Navigating the Storm” underlines that the Indian economy has proved remarkably resilient to the ongoing impacts of the deteriorating external environment, growing faster than most major emerging market economies (EMEs).
With the banking system in good health to support the nation’s economic recovery, private-sector investment is anticipated to rise in the forthcoming year, making India the bright spot in the Asian business and investment landscape.
Amidst these conditions, specific trends are also driving further increases in the country’s inbound investment and making India a hotbed for companies from around the world that are seeking to:
- Diversify their Asia presence;
- Access the Indian and South Asian markets;
- Supplement their China operations; and
- Leverage highly attractive free trade agreements, production, and market advantages.
India’s economy and borders are open, requiring no quarantine on arrival (read our COVID-19 in India: Travel Updates and Restrictions here). The government abandoned its original ‘zero-covid’ approach in 2021, which has allowed businesses and production plants to resume operations and create a foundation for the economy to bounce back strongly.
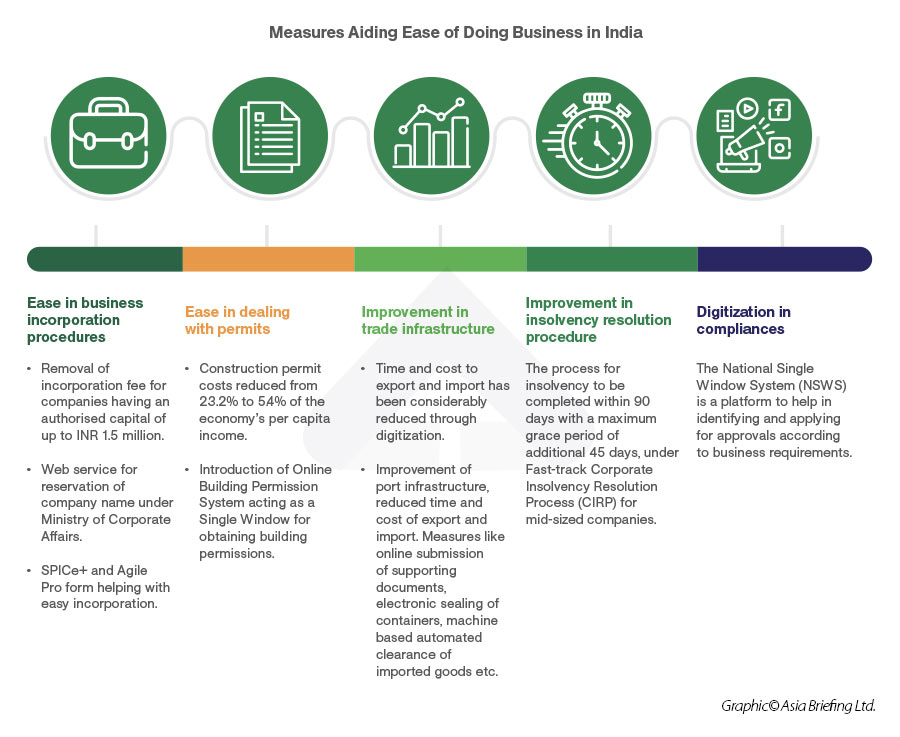
Ease of doing business
At the heart of Ease of Doing Business reforms in India has been an extensive focus on rationalization and digitalization of regulatory compliances, encompassing the entire business cycle from start to exit. Rationalization of regulatory compliances received the topmost priority in India. In 2022, the government has worked to simplify, rationalize, and digitize 33,000 compliances across federal ministries, departments, and States.
Trade facilitation has also seen a flurry of reforms recently, where India’s global ranking jumped up from 146th position in 2018 to 68th position in 2020. Initiatives such as the shift towards a paperless compliance system, greater clearances through a Risk Management System, etc., have helped lower dwell time and transaction costs for exporters and importers. Rigorous reform measures introduced as part of the Business Reform Action Plan (BRAP) since 2014—entailing their annual assessment and rankings—have also contributed to sustained improvement in the business environment at a pan-India level.
Some of these reforms are:
Economic outlook
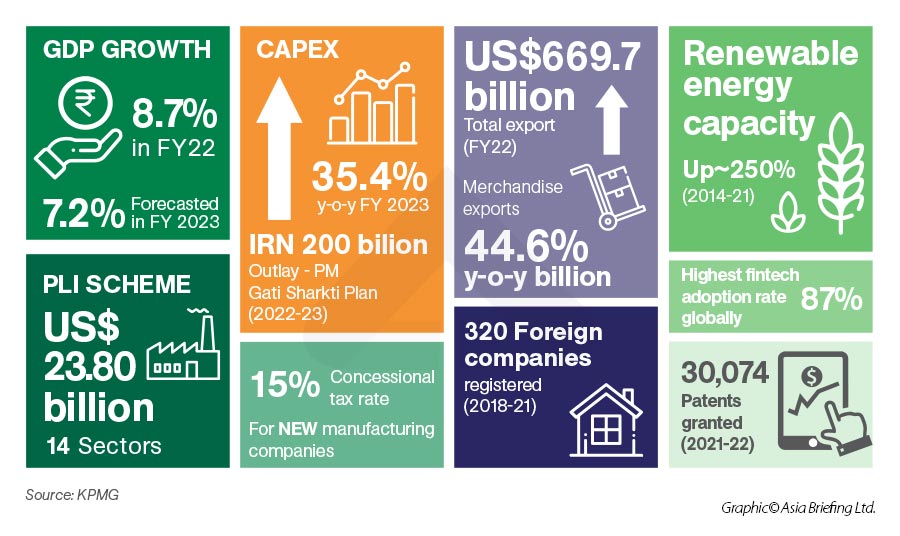
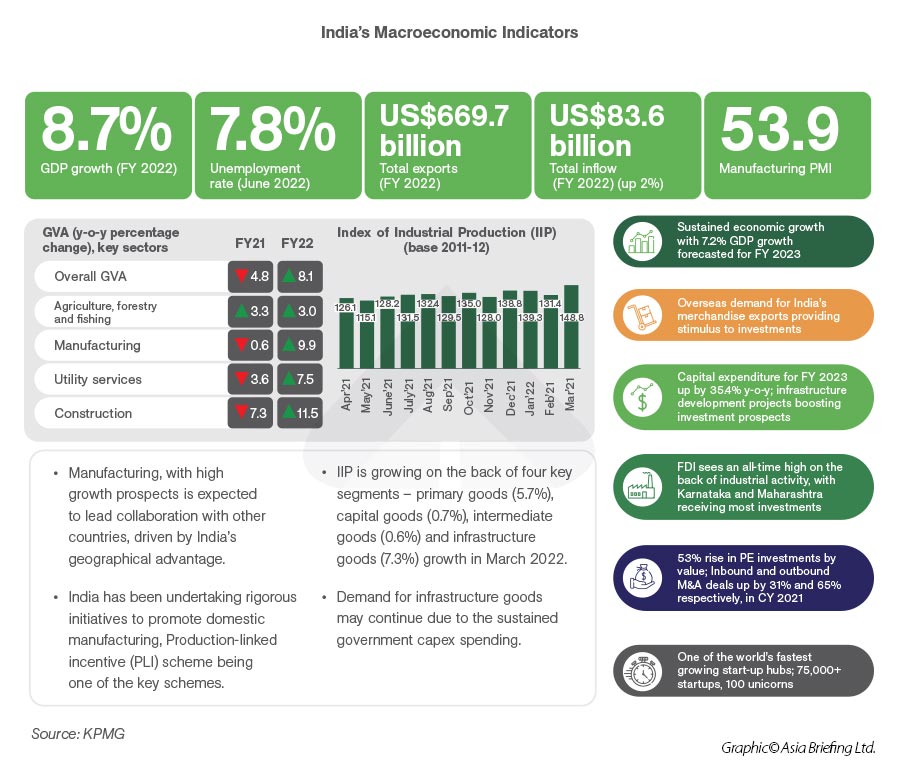
India's investment climate has improved considerably since the opening up of the economy in 1991 due to a more enabling regulatory regime and eased foreign direct investment (FDI) norms. As per government sources, India received the highest-ever foreign inflow of US$83.6 billion in the financial year FY 2022 and is set to attract US$100 billion in FDI in FY 2023 on account of continued economic reforms and ease of doing business.
India’s International Free Trade and Tax Agreements
India has been talking free trade agreements (FTAs) with several partners – both bilateral and regional – over the past two years in a bid to boost export-oriented domestic manufacturing. New Delhi had set an ambitious export shipment target of US$450-$500 billion by FY 2023, and US$2 trillion by 2030, against US$291 billion in FY21. These FTAs cover a wide array of topics, such as tariff reduction impacting the entire manufacturing and the agricultural sectors; rules on services trade; digital issues such as data localization; intellectual property rights that may have an impact on the accessibility of pharmaceutical drugs; and investment promotion, facilitation, and protection.
In the last five years, India has signed 13 FTAs with its trading partners, including the three agreements, namely the India-Mauritius Comprehensive Economic Corporation and Partnership Agreement (CECPA), India-UAE Comprehensive Partnership Agreement (CEPA – in effect from May 2022), and the India-Australia Economic Cooperation and Trade Agreement (IndAus ECTA – in effect from December 29, 2022). Additionally, India and the UK are working on finalizing their trade negotiations for an FTA. Further, India is also actively negotiating with Canada, the EU, and Israel to conclude FTAs.
Double Tax Avoidance Agreements
Double Tax Avoidance Agreements treaties effectively eliminate double taxation by identifying exemptions or reducing the amount of taxes payable in India.
India has one of the largest networks of tax treaties for the avoidance of double taxation and prevention of tax evasion. India has established over 94 comprehensive DTAAs and eight limited DTAAs, compared with China’s 110 and Vietnam’s 80. The purpose of such tax treaties is to develop a fair and equitable system for the allocation of the right to tax several types of income between the ‘source’ and ‘residence’ countries
It is, therefore, extremely worthwhile for foreign investors to be aware of which double taxation avoidance agreements (DTAAs) between India and other countries might be applicable to their situation, as well as understand how these agreements are applied.
Why do businesses relocate to India?
To size up India, or any country, as a potential destination for relocation, it is vital that foreign investors diligently research their options across many factors that are relevant to their situation. Such factors may include infrastructure, locations, talent availability, access to raw materials, incentives, supply chain partners and logistics, and others.
The country has doubled down on efforts to diversify its economy, resulting in the prominence of its services sectors, boosted by ICT capabilities and English as the lingua franca.
Here are some top reasons why companies choose to relocate to India:
- All of the stated Top Reasons to Invest in India.
- India is a prime location for foreign multinationals - a major investment hub in South Asia and well-connected to central, west, southeast, and east Asian countries.
- The country has doubled down on efforts to diversify its economy, resulting in the prominence of its services sectors, boosted by ICT capabilities and the labor forces' English language skills.
- Numerous industrial zones, workforce and labor availability, lower labor costs, and a relatively open environment for foreign direct investments.
- India’s large labor and consumer base, low operating costs, and linkages to important international markets.
- Well-established Judiciary and prevalence of the rule of law.
- India is a democratic, secular republic with a stable political environment and broad consensus across the political spectrum on the direction of the economy.
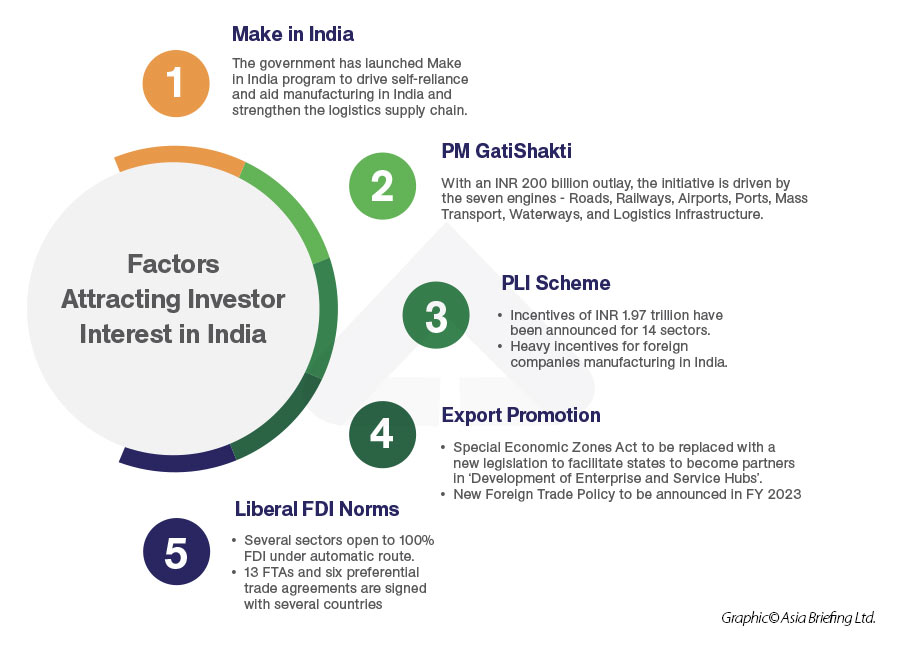
- Massive investment in infrastructure to improve last mile connectivity, speed up and reduce the cost of carrying goods:
- East and west dedicated rail freight corridors;
- National Infrastructure pipeline;
- Gatishakti; and
- Sagarmala.
India’s advantage as a China +1 destination
The COVID-19 pandemic, the US-China trade war, China’s lockdowns and “dynamic zero COVID” approach, as well as other recent regional and global events, have disrupted some China and regional supply chains. This has pressured foreign-invested businesses that had been reliant on China sourcing or production to diversify or seek alternative destinations.
China’s costs have been rising for more than two decades, in and around its tier 1 and tier 2 cities, and are significantly higher in terms of operating costs than India’s. There is very high competition in China for skilled labor, and coupled with China’s aging population, has resulted in labor shortages in certain manufacturing, high-tech, and other specialized sectors.
On the other hand, in addition to a population of 1.4 billion people, India has a large, young population. More than half of India’s total population is under the age of 25, and two-thirds are less than 35 years of age. By 2027, India is likely to have the world’s largest workforce, with a billion people aged between 15 and 64. Analysts expect this large, young workforce to make a significant contribution to India’s growing consumer base.
India has some of the lowest labor costs in Asia: an hourly labor cost in India is roughly one-third the cost of the same hour in China.
India’s infrastructure development
The Indian infrastructure sector has a multiplier effect on several other sectors. India is expected to become the world’s third-largest construction market by 2025.
To ease progress in India’s infrastructure, the government has implemented policies to minimize bureaucratic delays, which include simplification of land acquisitions, faster clearance/approvals from relevant authorities, using technologies such as online computerized Monitoring System (OCMS) and Pro-Active Governance and Timely Implementation (PRAGATI) to improve project monitoring, and creating cost committees at the federal level to monitor cost overruns.
The government launched the National Infrastructure Pipeline (NIP) for FY 2019-25, under which projects have been identified to construct, refurbish, strengthen, and expand road networks, housing, urban development, railways, conventional power, renewable energy, and irrigation. Key programs will focus on highways and railways.
The Industrial Corridor Projects, part of the National Industrial Corridor program, is an example, and aligns with the development of industrial cities and improving inter-city connectivity so that they can compete with top global investment destinations. In addition, the government has also established a Special Purpose Vehicle for the construction, operation, and maintenance of dedicated freight corridors under the Dedicated Freight Corridor (DFC) program that aims to decongest the existing rail network by constructing dedicated tracks for goods trains. Currently, the construction work for both projects is in full swing.
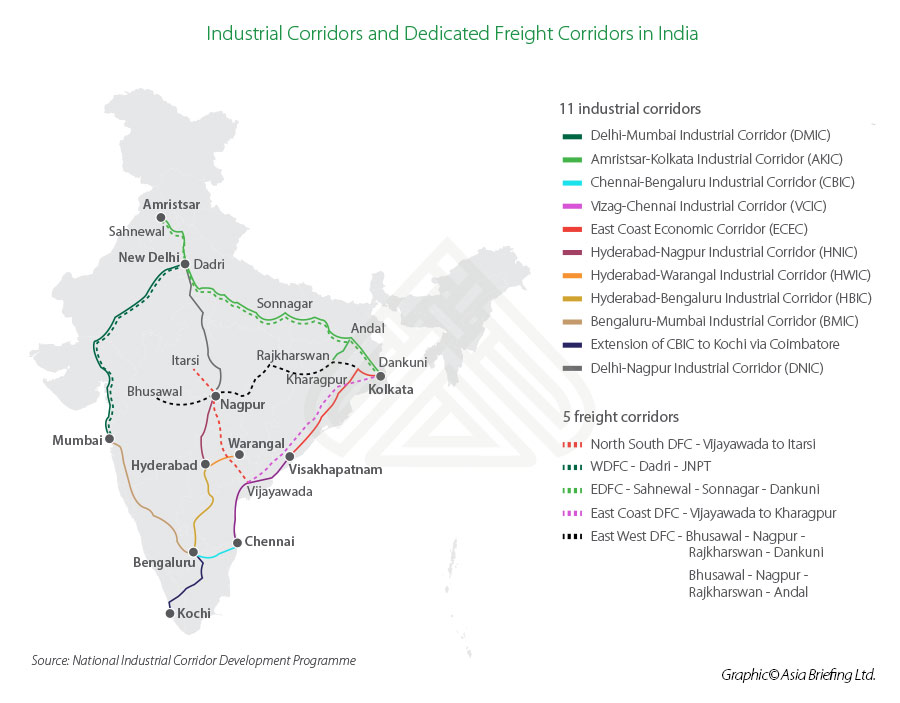
For port infrastructure, since its launch, the Sagarmala Program (2015-2035) has identified more than 574 projects worth INR 6.01 trillion across areas of port modernization and new port development, port connectivity enhancement, port-linked industrialization, and coastal community development.
As of September 30, 2019, a total of 121 projects at a cost of INR 302.28 billion have been completed, and 201 projects at a cost of INR 3.09 trillion are under implementation. The states of Gujarat, Maharashtra, Karnataka, Andhra Pradesh, and Tamil Nadu, among the top investment destinations in India, account for the country’s ports and sea routes.
Incentives, workforce, and economic zones
Incentives for doing business in India
There are various incentives available to businesses depending on the economic activity, industry, location, and size of the firm.
India offers tax relief at both the central and state level. Additional incentives are available to investors in specific sectors, while India’s special economic zones (SEZs) offer their own comprehensive tax relief. However, not all tax benefits offered are mutually inclusive.
Corporate tax incentives for eligible companies
- Tax on domestic companies engaged in manufacturing, set up after April 1, 2016, shall be a 25 percent rate provided such companies do not avail specific tax incentives or deductions.
- With effect from April 1, 2020 the corporate income tax rate for domestic companies is 22 percent rate, provided such companies do not avail of specific tax incentives or deductions.
- Tax on new domestic manufacturing companies set up after October 1, 2019, is 15 percent, provided such new manufacturing company is set up before March 31, 2024.
The concessional tax regime (22 percent) for domestic enterprises is applicable only if they do not avail of specific tax incentives or deductions. (The effective tax rate for these domestic companies is around 25.17 percent inclusive of surcharge and cess.)
Those companies opting for the concessional corporate tax rate do not have to pay minimum alternate tax. India’s current effective tax rate brings it at par, on average, with leading Asian investment destinations and manufacturing hubs like China, Vietnam, Malaysia, Singapore, and South Korea.
|
Tax Rates for Domestic Companies for FY 2023-24 |
||
|
Section |
Conditions |
Tax rates (%) |
|
Section 115BA |
|
25% |
|
Section 115BAA |
|
22% |
|
115BAB |
|
|
|
First Schedule to Finance Act 2010 |
Turnover or gross receipt of the company is less than INR 4 billion in the previous year |
25% |
|
First Schedule to Finance Act 2010 |
Other domestic company |
30% |
|
Surcharge Applicable to Companies for FY 2023-24 |
|
|
Total income |
Surcharge rate (%) |
|
If total income is more than INR 10 million |
7% |
|
If total income is more than INR 100 million |
12% |
|
If domestic company opted for sections 115BAA and 115BAB |
10% |
|
Note: The amount of income tax and the applicable surcharge shall be further increased by health and education cess calculated at the rate of four percent of such income tax and surcharge. |
|
Other incentive types
Several other types of incentives are offered by the Indian government in qualifying, special circumstances. These are explained in our incentives guide.
Foreign companies choosing where to set up in any of India’s states should note that each region has its own set of policies and incentive schemes. The applicability of incentives usually varies based on:
- The state’s location;
- The products that will be manufactured;
- The scale of investment; and
- The creation of jobs.
India’s promising workforce
India possesses a large labor pool as almost half its population of 1.4 billion is of working age. Naturally, the structure of India’s labor market is diverse; foreign companies need to understand this structure to benefit from India’s demographic dividend.
Much of the working population is engaged in the unorganized or informal sector, working for small businesses or manufacturing units that employ less than ten individuals. Businesses that don’t need skilled labor can source employees with some ease.
The expansion of higher education has created a larger skilled talent pool, but it still only amounts to about ten percent of the country’s overall labor market. Companies seeking skilled labor need to be prepared to compete to recruit from this comparatively small pool.
Labor costs in India
Firms entering the Indian market often choose to make the decision after assessing the comparative costs of labor. India offers competitive advantages with its lower wage structure and access to a vast labor market. For instance, India offers the most competitive labor costs in Asia, with the national-level minimum wage at around INR 178 (US$2.16) per day, which works out to INR 5340 (approx.US$65) per month. This number is a floor-level wage – and the wage rate will vary depending on geographical areas and other criteria.
Employers should note that the minimum wage in India is indicative; it is often utilized as a benchmark, especially in the employment of unskilled and semi-skilled labor in the manufacturing sector.
Labor costs also vary by region in India; wages in tier two and three cities are much lower than in tier one due to lower costs of living and affordable real estate. The difference in salary pay scale can be up to 25 percent as the city compensatory allowance and employee conveyance allowance is a much smaller portion of paychecks in tier two and three cities when compared with tier one cities. Therefore, for instance, the average salary of a software engineer in New Delhi is US$7,632.53, while in Mysore, it is US$6,621.47.
Special Economic Zones
Special economic zones (SEZs) in India are areas that offer incentives to resident businesses. SEZs typically offer competitive infrastructure, duty-free exports, tax incentives, and other measures designed to make it easier to conduct business. Accordingly, SEZs in India are a popular investment destination for many multinationals, particularly exporters.
While India’s SEZs are similar to those found in other parts of Asia, business leaders who are considering setting up a SEZ should seek to understand how SEZs work in India. Each SEZ is unique. Many business leaders conduct market entry studies that compare sites, resources, tax incentives, and costs before making site visits.
Summary: Top 10 reasons to invest in India
|
1. |
Strategic Location |
Strategic destination for manufacturing and China +1, a major investment hub in South Asia, and well connected to central, west, southeast, and east Asian countries |
|
2. |
Growing Economy |
Strong economic GDP growth, including continuing annual GDP growth, competing consistently with global and regional peers. |
|
3. |
Network of SEZs |
Multiple SEZs offer competitive infrastructure, duty-free exports, tax incentives, and other measures designed to make it easier to conduct business. |
|
4. |
Ease of Doing Business |
Improving ease of doing business for foreign investors. |
|
5. |
Large, young labor force |
By 2027, India is likely to have the world’s largest workforce, with a billion people aged between 15 and 64. |
|
6. |
Incentives for Doing Business |
There are various incentives available to businesses depending on the economic activity, industry, location, and size of the firm. |
|
7. |
Strong FDI Environment |
Most sectors are open to FDI.
|
|
8. |
Progress in Infrastructure Development |
Several policies implemented nationwide to construct, refurbish, strengthen, and expand infrastructure. |
|
9. |
Network of FTA's and DTAs |
Signatory of more than 13 Free Trade Agreements and one of the largest networks of tax treaties for the avoidance of double taxation and prevention of tax evasion. |
|
10. |
Integration with Legal Frameworks |
WTO member and signatory of most major worldwide Intellectual Property Protection conventions, protocols and agreements. |