


 5 / 12


5
100,000
1,000,000
10,000
1,000
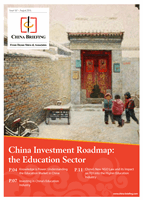
Education in China 2014
China's Education Industry at a Glance
Rural
Per CapitaHousehold Expenditure
on Education and Arts (RMB)
Urban
2500
2000
1500
1000
500
2013
2014
Foreign Direct Investment
Number of projects
Investment actually utilized
(USD 1,000,000)
25
20
15
10
5
25
20
15
10
5
2014
Percentage of
18-22 year olds in
higher education
1990
4
1999
6.5
2014
37.5
20.97
20
Breakdown of Overall Investment in China’s Education
Industry (% of investment)
K12 tutoring
Vertical platforms
Early childhood education
Education informationization
Vocational education
Study abroad
Others
25.4
18.5
17.4
7.7
6.3
6.3
10.9
Number of preschools
Educational stages
225,000
200,000
175,000
150,000
125,000
100,000
75,000
50,000
25,000
2010
2011
2012
2013
2014
2010
2011
2012
2013
2014
Number of vocational
secondary schools
14,000
13,500
13,000
12,500
12,000
11,500
11,000
10,500
10,000
Gross enrollment
*Compulsory
**The gross enrolment ratio refers to the age group o cially associated with a given level of
education; the gross enrolment ratio can therefore exceed 100% due to grade repetition or
students beginning their education at an atypical a
PRESCHOOL
PRIMARY SCHOOL*
SECONDARY SCHOOL*
HIGH SCHOOL
HIGHER EDUCATION
70.5%
99.81%
103.5%**
86.5%
37.5%
*Compulsory
EARLY EDUCATION
PRESCHOOL
PRIMARY/ELEMENTARY*
JUNIOR SECONDARY*
UPPER SECONDARY
HIGHER EDUCATION
0-3
3-5
6-12
12-15
15-18
18
+
754.6
1988.3
859.5
Number of private higher
education institutions
900
800
700
600
500
400
300
200
100
2010
2014
39
727
2142.3
Net Overseas Direct
Investment
40
35
30
25
20
15
10
5
2013 2014
Unit: USD 1,000,000
35.66
13.55
Child dependency ratio
22.5
22.4
22.3
22.2
22.1
22.0
2010
2011
2012
2013
2014
22.5
22.2
22.2
22.1
22.3
13,872
150,420
166,750
181,251
198,553
209,881
13,177
12,663
12,262
11,878
Total Investment in
Fixed Assets (Education)
Unit: 100 million
7,000
6,000
5,000
4,000
3,000
2,000
1,000
2010
2011
2012
2013
2014
4033.6
3894.6
4613 5433
6708.7
210,000
PRESCHOOLS
26,000
SENIOR SECONDARY
2,000
SPECIAL EDUCATION
2,824
UNIVERSITIES
1,327
Vocational schools
1,202
Academic schools
295
Adult colleges
254,000
COMPULSORY SCHOOLS
201,400
Primary schools
52,600
Junior secondary schools